
Technical Analysis in Forex Trading: A Comprehensive Guide
What is Technical Analysis?
Technical analysis in forex trading involves analyzing past price movements and volume to forecast future market moves. By focusing on historical price data and ignoring macroeconomic variables, traders use charts, indicators, and patterns to spot trends and predict price behavior.
Key Takeaways
- Technical analysis in forex trading helps traders forecast price movements by studying past data.
- Support and resistance levels identify optimal trade entry and exit points.
- Moving averages and oscillators highlight trends and market momentum.
- Patterns like trends, retracements, and ranges provide insights into market movements.
- Tools like price charts, trend lines, and Fibonacci retracements are essential for technical analysis.
- Even in 2025, technical analysis remains popular but should be combined with other strategies to navigate unpredictable market conditions.
Key Concepts of Technical Analysis
Support and Resistance
Support and resistance levels are fundamental in technical analysis in forex trading. Identifying these levels helps traders determine entry and exit points for their trades.
- Support: A price level where a currency pair stops falling and starts rising.
- Resistance: A price level where the price stops rising and begins to fall.
Trends and Ranges
Recognizing trends or ranges enables traders to adopt strategies like trading range boundaries or retracements.
- Trends: Indicate steady price movement in one direction.
- Ranges: Show price fluctuations between defined highs and lows.
Retracements
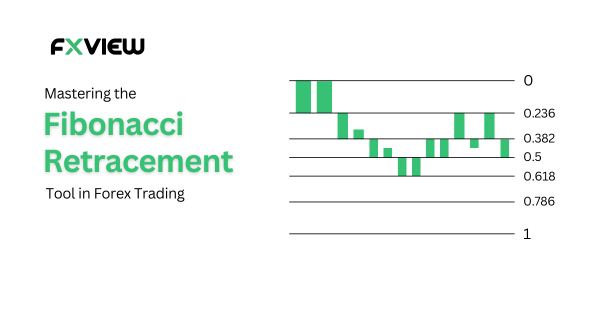
Retracements are temporary reversals in the direction of the market trend. Traders often use Fibonacci retracement levels to predict possible pullbacks before the trend resumes. In forex trading, retracements highlight low-risk entry points within a trend.
Moving Averages
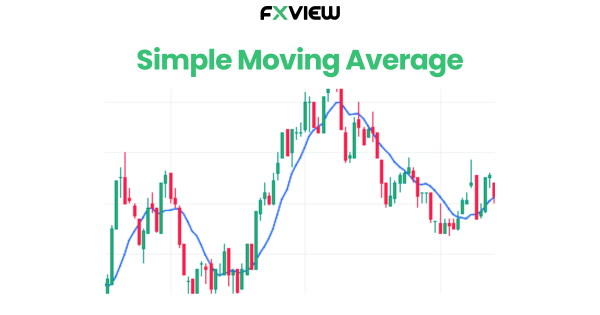
Moving averages smooth out price data, revealing the average value of a currency pair over a period. They help identify trends and potential reversals.
- Simple Moving Average (SMA): Provides equal weight to all data points.
- Exponential Moving Average (EMA): Prioritizes recent data for faster trend detection.
Oscillators
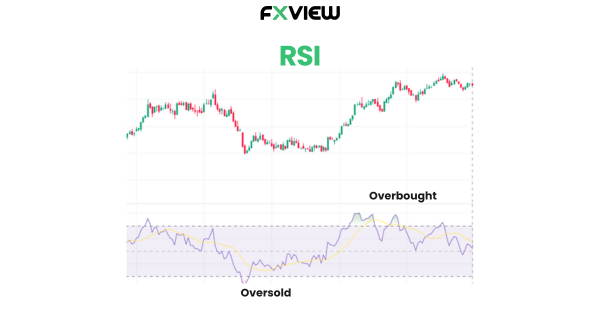
Oscillators, such as the Relative Strength Index (RSI) and Stochastic Oscillator, measure market momentum and indicate whether a currency pair is overbought or oversold. These tools are essential in identifying potential price reversals.
Tools Used by Technical Analysts
Price Charts
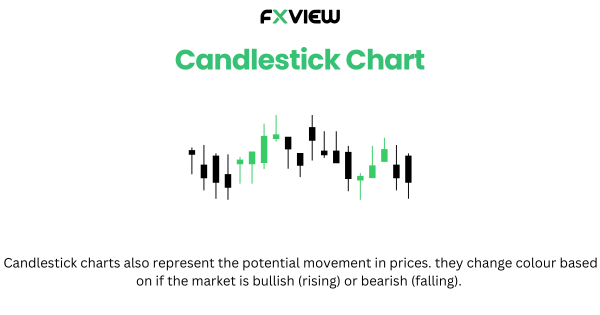
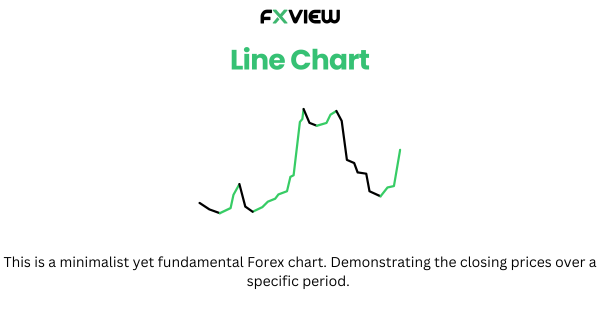
Price charts are essential tools for visualizing market behavior over time. Candlestick charts are particularly popular for their detailed insights, showing open, close, high, and low prices for a given period. Line charts, on the other hand, provide a simpler representation by connecting closing prices over time, making them useful for identifying general trends without the noise of intraday movements.
Trend Lines
Trend lines highlight the market’s general direction, whether upward or downward. They remain a vital tool in technical analysis in 2025, aiding in visualizing market trends.
Indicators
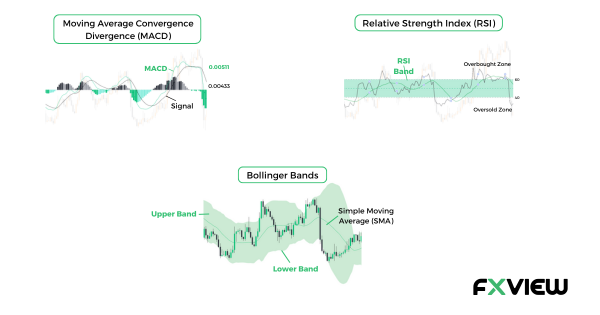
Indicators like moving averages, Bollinger Bands, and MACD (Moving Average Convergence Divergence) analyze price data to forecast market movements. These tools guide traders in making informed entry and exit decisions.
Fibonacci Retracements
Based on the Fibonacci sequence, these retracement levels predict where prices might pull back before continuing their trend, serving as potential support or resistance points.
Trading Platforms
Platforms like ActTrader, MetaTrader, and TradingView offer built-in indicators, charting tools, and historical data, making technical analysis accessible and effective.
Benefits of Technical Analysis
Accessibility and Simplicity
Technical analysis is straightforward, making it suitable for both beginners and experienced traders. Tools like moving averages and trend lines are readily available and easy to use.
Applicable Across Multiple Timeframes
This analysis works for various timeframes, accommodating short-term day traders and long-term investors alike. Traders can tailor strategies to their preferred timeframes.
Data-Driven Decisions
By relying on price charts and patterns, technical analysis promotes objective and consistent trading decisions, minimizing emotional bias.
Spotting Trends Early
Early identification of trends allows traders to enter positions before significant price movements, maximizing potential profits.
Drawbacks of Technical Analysis
Limited by Past Data
Technical analysis relies on historical data, which may not account for unexpected news, economic shifts, or geopolitical events that disrupt predicted trends.
Excludes Fundamental Data
It focuses solely on price, ignoring fundamental factors like economic reports or political developments, which can heavily influence the forex market.
Overwhelming for Beginners
The vast array of indicators and strategies can be daunting for new traders, requiring time to master the tools and their interpretations.
Conclusion
Technical analysis in forex trading is a powerful tool for forecasting market movements, offering accessible methods for identifying trends and patterns. By utilizing tools like price charts, trend lines, and oscillators, traders can make informed decisions based on data rather than speculation. However, it’s essential to acknowledge its limitations and combine it with other strategies, such as fundamental analysis, to navigate the dynamic forex market effectively.
Disclaimer: The information contained in this article is provided for educational and informational purposes only and it is not intended to be, nor does it constitute financial, investment or trading advice. You should not make any financial, investment or trading decision based on the information provided in this article without performing your own research or seeking advice from an independent advisor.


