Easy Forex Trading with Candlestick Patterns
In the dynamic world of forex trading, one undeniable truth prevails: predicting the next move of the market can be quite a difficult task. Yet, armed with knowledge, we could be able to better identify market signals and make educated estimations and informed decisions. And one such tool could be candlestick patterns.
Picture these patterns as the Morse code of forex – they convey insights about potential price shifts and trend extensions, empowering us with informed choices. So, without further ado, let’s embark on a journey into the universe of forex candlestick patterns, delving into the top ones that serve as our guides in the trading realm.
The Mighty Hammer & Inverted Hammer
The Hammer emerges as a potential bullish symbol at the downtrend’s close. It’s a forceful sign of a possible reversal, characterised by a small body, an elongated lower shadow, and a minuscule or absent upper shadow. Now, flip this script to reveal the inverted hammer. This figure often emerges at the downtrend’s bottom, suggesting the possibility of a potential upward turn.
The Hanging Man & Shooting Star Candlestick
Meet the counterparts of these signals – the Hanging Man and the Shooting Star. The Hanging Man signals an uptrend’s potential end, while the Shooting Star, contrary to its name, may warn of a bearish phase following an uptrend. These patterns could offer insights into when to consider exiting long positions.
Engulfing Candlestick Patterns (Bullish and Bearish)
Engulfing patterns are like Forex’s Pac-Man. The potential engulfing pattern forms when a small bearish candle is devoured by a larger bullish one, signifying bullish dominance. Conversely, the bearish engulfing pattern signifies bears taking the reins, as a small bullish candle is overtaken by a larger bearish one.
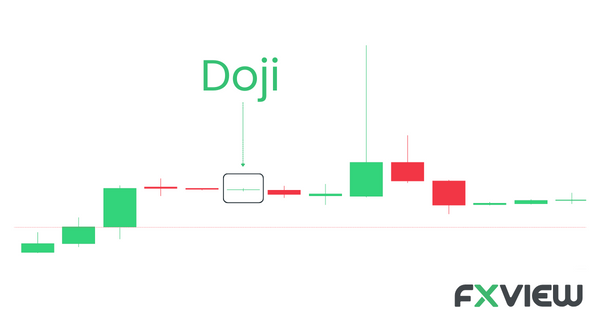
The Doji
Behold the Doji – a balanced seesaw in the forex realm. It may signify market indecision, with open and close prices aligning. The Doji’s interpretation varies depending on preceding trends and can suggest potential reversals. Variations like the long-legged, dragonfly, and gravestone Doji each carry their unique meanings.
Morning Star and Evening Star Candlestick
No astrological talk here – the Morning Star heralds a potential bullish reversal after a downtrend, akin to a sunrise of an uptrend. Conversely, the Evening Star, following an uptrend, may signify twilight and the possible approach of bears.
Piercing Line & Dark Cloud Cover
The Piercing Line and Dark Cloud Cover offer a yin-yang dynamic. A Piercing Line signals a potential bullish reversal, while the Dark Cloud Cover may indicate an approaching bearish phase.
Harami Candlestick Pattern (Bullish & Bearish)
Enter the Harami- a pattern resembling a mother and child. Bullish Harami appears at the downtrend’s end and may signal a potential bullish reversal. In contrast, the Harami arises at an uptrend’s conclusion, indicating a potential bearish reversal.
Three Black Crows & Three White Soldiers Candlestick
These names evoke fairy tales, but their essence is business. Three Black Crows, a bearish trio, could symbolise an end to a bullish market. Meanwhile, Three White Soldiers, a bullish trio, symbolises a possible bullish trend.
Always bear in mind, that while these candlestick patterns could be enlightening, they’re not infallible and you should not explicitly rely on them. You may pair them with other tools and market knowledge in order to be able to make informed decisions and plan your next moves. Patience and practice could be your allies as you gradually understand these patterns.
Key Takeaways
- These patterns may act as indications for potential price reversals and trend continuations in forex trading.
- Patterns like Hammer and Inverted Hammer signal potential bullish reversals, while Hanging Man and Shooting Star may suggest bearish shifts.
- Engulfing Patterns may show market control changes, Doji may reflect indecision, and Morning Star/Evening Star may mark potential trend reversals.
- Patterns such as Piercing Line/Dark Cloud Cover may hint at reversals, Harami may suggest shifts and Three Black Crows/Three White Soldiers could indicate market turning points.
- Apply these patterns carefully alongside other tools, as trading requires patience, practice, and a holistic approach.
Disclaimer: The information contained in this article is provided for educational and informational purposes only and it is not intended to be, nor does it constitute financial, investment or trading advice. You should not make any financial, investment or trading decision based on the information provided in this article without performing your own research or seeking advice from an independent advisor.
Related Posts
Forex Scalping Basics
Forex Day Trading: A Beginner’s Guide!